After releasing the graph view yesterday I got to thinking that it might be nice if the "tooltips" for the nodes in the graph were a little richer. Since we already know how many posts are within a category, or have a specific tag, it makes sense that those counts should be shown; posts themselves have descriptions available and some even have cover images that could be turned into thumbnails. Why not make use of all of that?
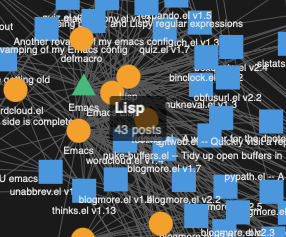
So I've made use of all of that. As mentioned, categories and tags simply show the count of posts related to them:
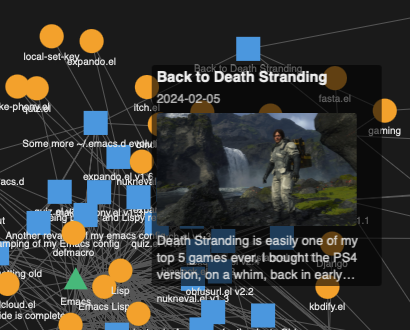
Posts will show the title, date, description and the cover image if available:
I'll admit that the transparency is a little distracting -- this comes from the library being used for the graph -- but I kind of like it. I'm going to roll with it now and see how I feel about it as time goes on. It's not like I expect a reader to read the post in the tooltip, it's an invitation to click through and read the actual post.
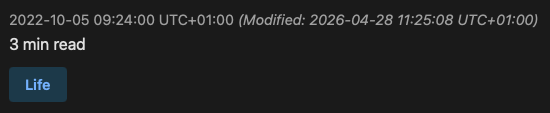
Another small change is something I've been meaning to address for a while. While BlogMore supports a modified time for a post it never shows it or uses it in any meaningful way. So now I've updated the way the time of a post is displayed so that, if there is a modified time, it's also shown:
The final change came in as a request over on Mastodon. The wish being that there was an easy method, that didn't require the user spin out their own copy of a template just to do it, of changing the title of the backlinks section on a post from "References & Mentions" to something else. That seemed fair so I've introduced backlinks_title.
I did some more tinkering with BlogMore yesterday, adding two new features. The first is one I've been considering adding for a wee while now.
For a large part of the lifetime of this blog I used Disqus to provide a comments section on every post. It was, as you'd imagine for a small personal blog, a pretty quiet thing; I'd get the odd comment from time to time but it wasn't significant. This worked well for the longest time, until Disqus decided that they were going to force adverts into your pages if you were using the free tier. Now, I'm fine with paying for tools I use, but I wasn't using Disqus enough to make the cost worth it. I'm also not opposed to a bit of subtle advertising to help cover costs either.
What Disqus did wasn't subtle. It was far from subtle. It was a horror show of the worst kind of sleazy advertising you can imagine.
So I removed it and called it a day on comments.
After the work on BlogMore was well under way I did start thinking about this problem again. Given how BlogMore is constructed, anyone using it could override a template and include whatever they want; with this in mind I looked at static-site-friendly comment options but nothing really stood out. Every solution seemed to either heavily rely on a third party service (see above for possible problems), self-hosting such a service (spinning up hosts and web servers and databases and stuff is the antithesis of using a static site generator to get stuff done easily), or some hacky use of a social media platform or other discussion venue that would require the reader jump through hoops that really looks like "go away, I don't want to hear from you".
So I concluded that it just wasn't worth the effort and I've done nothing with it.
Meanwhile: on occasion I have had people just email me about a post. Good old email, like in the good old days of the Internet. I kind of liked that. In fact I really liked that. So over the weekend, after receiving just such an email the other day, I decided I'd add a feature to BlogMore that provided just that: an invitation to send an email at the end of every post.
The configuration file now has two new properties that support this. The first is invite_comments. This is a boolean value that simply turns on or off the feature. The second is invite_comments_to. This should be set to an email address that the reader will be invited to direct their comment or question or whatever.
I've made the latter a little smart, in that it's actually a template, so that you can control the email address used per-post. This could be great for filtering, etc. Examples could be:
blog-comment@example.com
blog-comment-{year}{month}{day}@example.com
{author}+comment@example.com
And so on. You get the idea.
Further to this there's also post frontmatter properties of the same name. In this case the frontmatter setting always overrides the configuration file setting, for that single post. Also the invite_comments_to frontmatter setting isn't a template -- it's being set for a single post so that didn't seem necessary. The point of the frontmatter is it gives the flexibility to turn the invite off for an individual post (or indeed turn it on if the global setting is for it to be off).
The effect of all of this is that, if the invitation setting is on and if there is an email address available, this little box will appear at the bottom of a post:
When the reader clicks on the link it should open their MUA of choice and pre-fill the to address, and should also pre-fill the subject with the title of the post they're emailing from.
At some point in the future it might be interesting to take this even further and produce a map of interconnected posts; for now though I think this is enough.
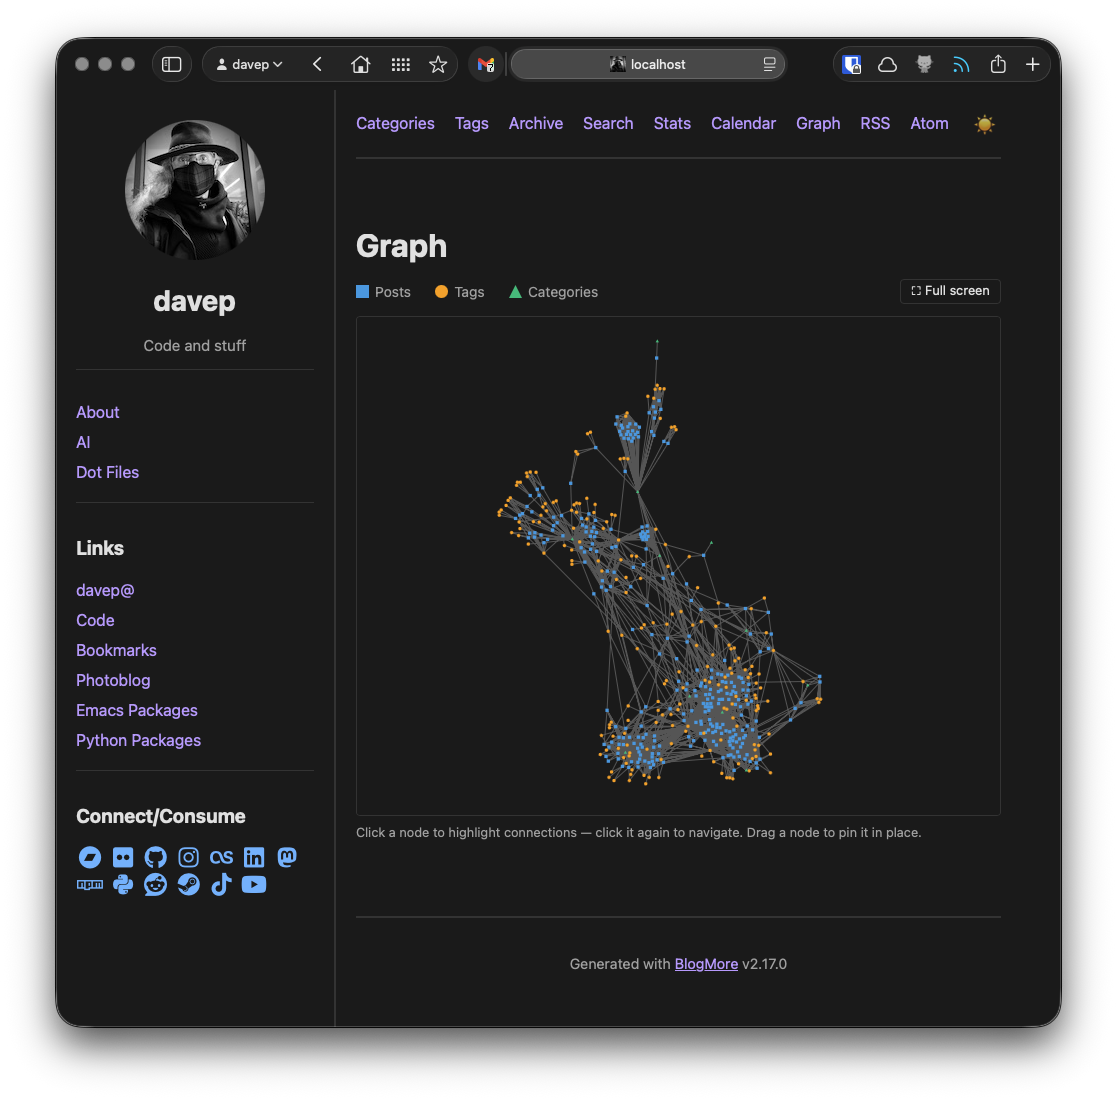
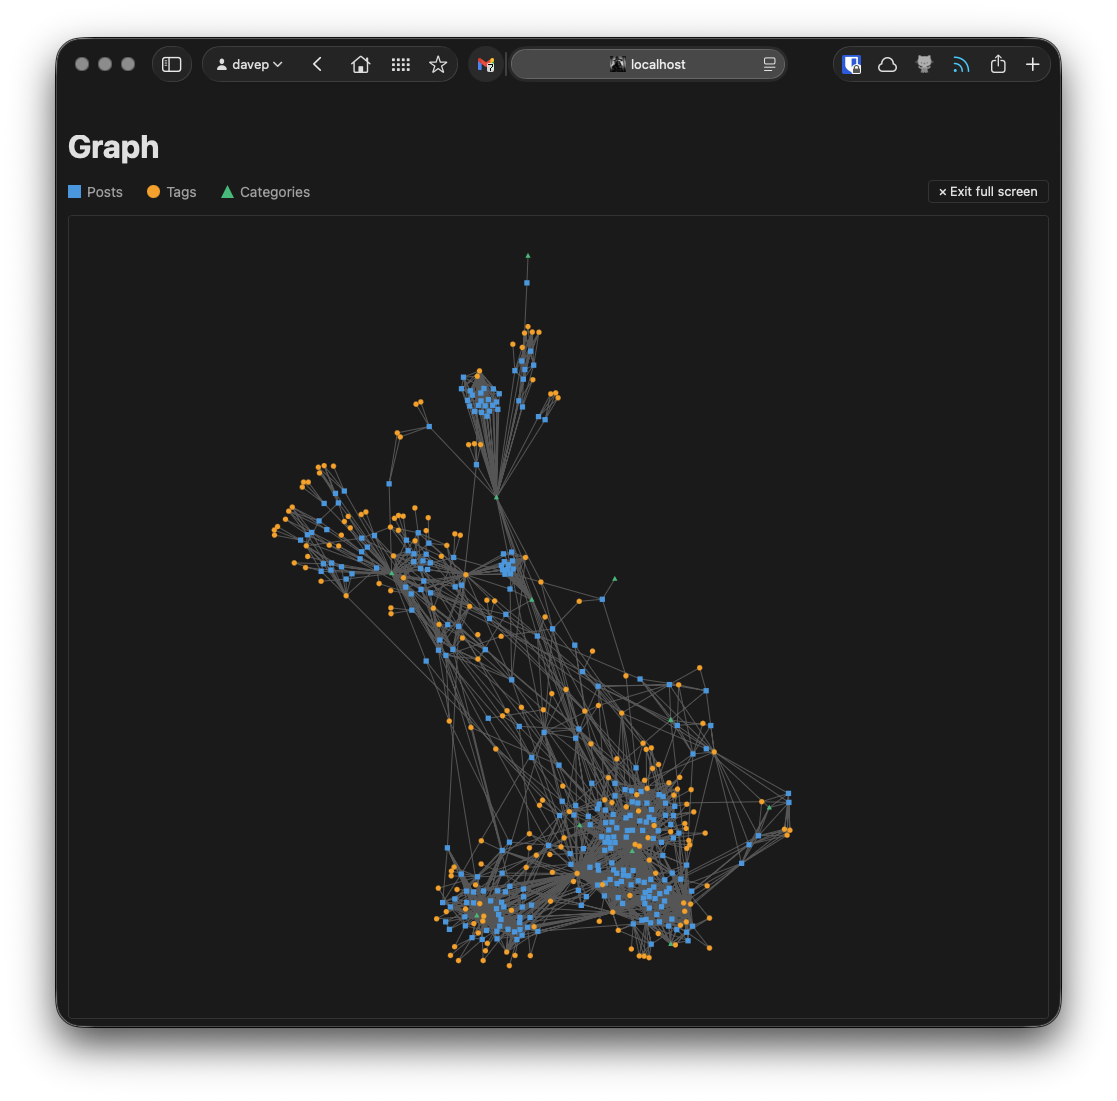
Apparently "some time in the future" was the following day; because that also got added while I was hacking on the sofa. There's a new --with-graph command line option, and with_graph configuration file setting, that adds a Graph page to the top "menu" of the blog. The result looks something like this:
Given the nature of the graph and that the viewer is naturally going to want to explore, it can be toggled into a "full screen" (well, "mostly most of the page") mode too:
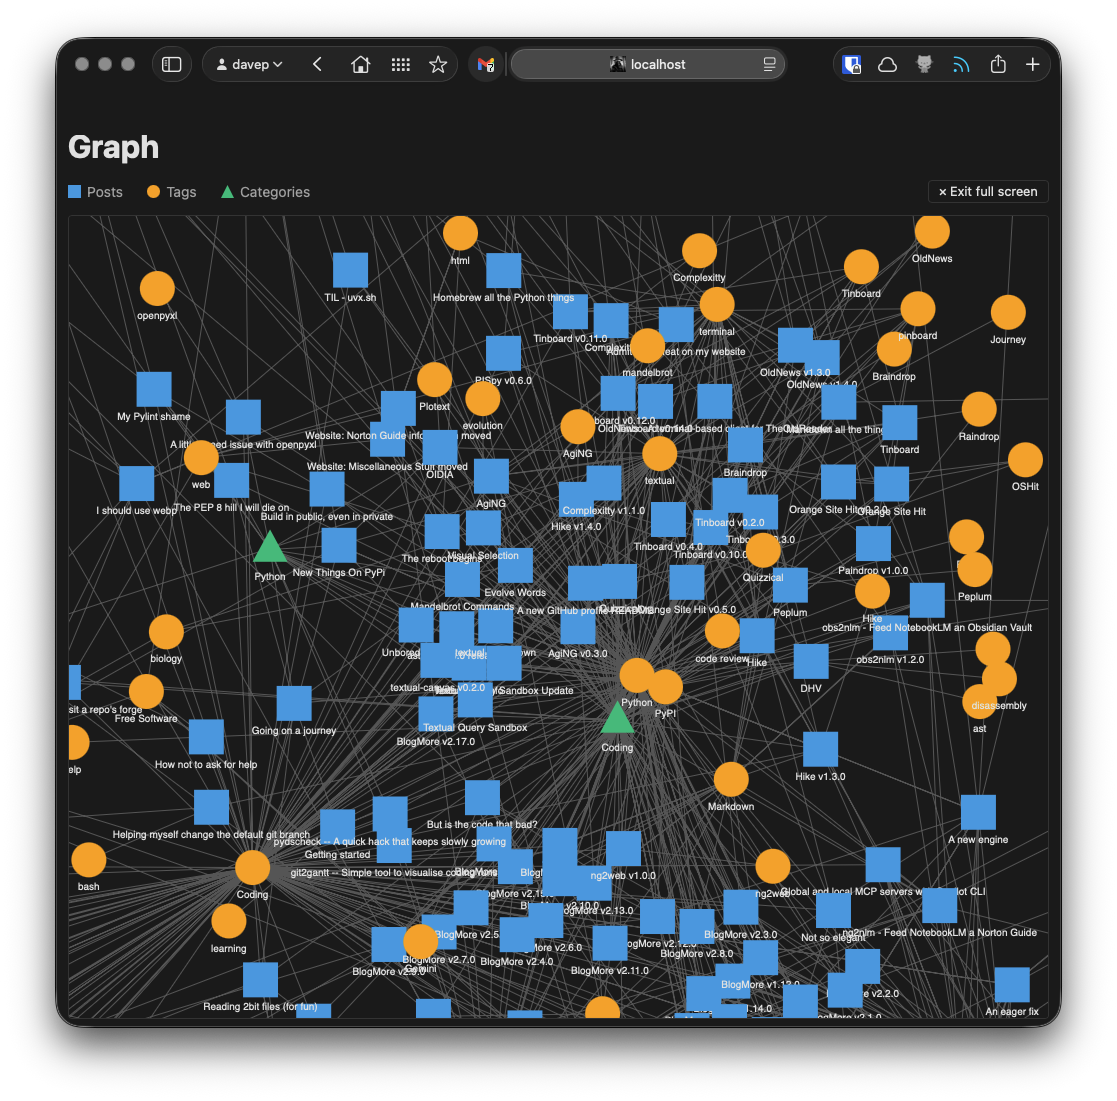
The graph itself (built using force-graph) can be explored in the ways you'd reasonably expect, allowing zooming, panning around, dragging nodes around to get a better view of things, and so on.
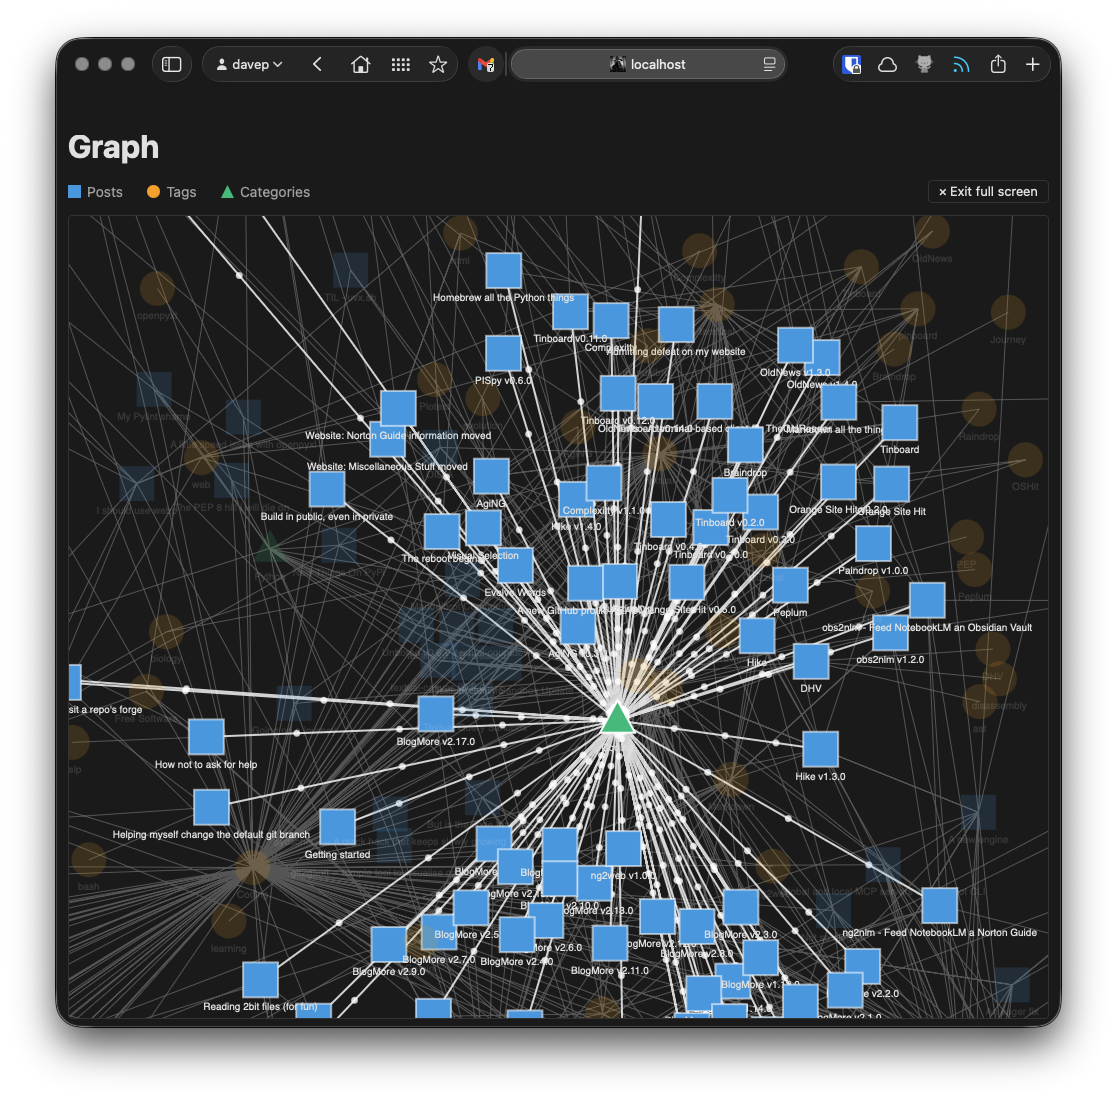
If you click on any of the nodes the graph will show you everything that's linked to it:
and if you click the node again it will take you to the post, tag archive or category archive, depending on what it is you are clicking on.
So far I'm finding this is working really well as yet another method of discovering posts and themes, etc; it's already helped me find some "under-used" tags that deserved to be added to posts to better connect things. I suspect the feature will need refining over time, especially from a cosmetic point of view, but the result feels very usable as it stands.
Some time around late October or early November last year, around the time I started working at Textualize, I "discovered" Obsidian. While I didn't need another note-taking application (having gone through Evernote, trying to use Org, dabbling with a couple of other things and finally settling mainly on Apple Notes), I was quite taken by its style and ubiquity and the fact that it was, at heart, just a bunch of Markdown files.
So quite quickly I started using it; not to replace Apple Notes (which is still my general note-taking tool of choice), but to keep work notes and a daily coding journal, the latter coming in useful for the quick end-of-day meetings we normally have.
One of the things I was quite taken by was the graph. It was interesting and fun to see how each of my work days related to other work days, and what subjects kept getting pulled in, etc.
So come the start of this year I had an idea: what would it be like to keep a personal vault, but one where I track things I've done. Not a journal as such (I do keep one of those too, have done for many years now, but that's for other far more important reasons -- perhaps I'll write about that one day too), just a daily record of stuff I've achieved, stuff I've actually done, the routine things and the exceptional things?
What would that graph look like?
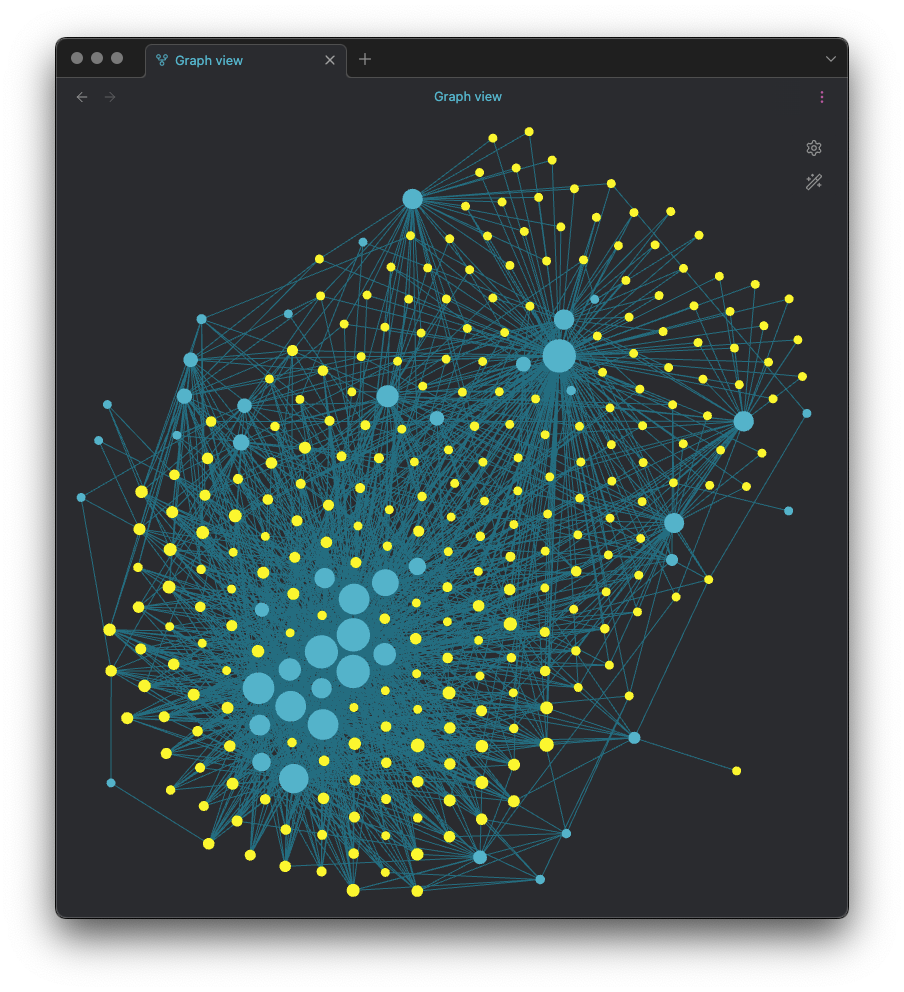
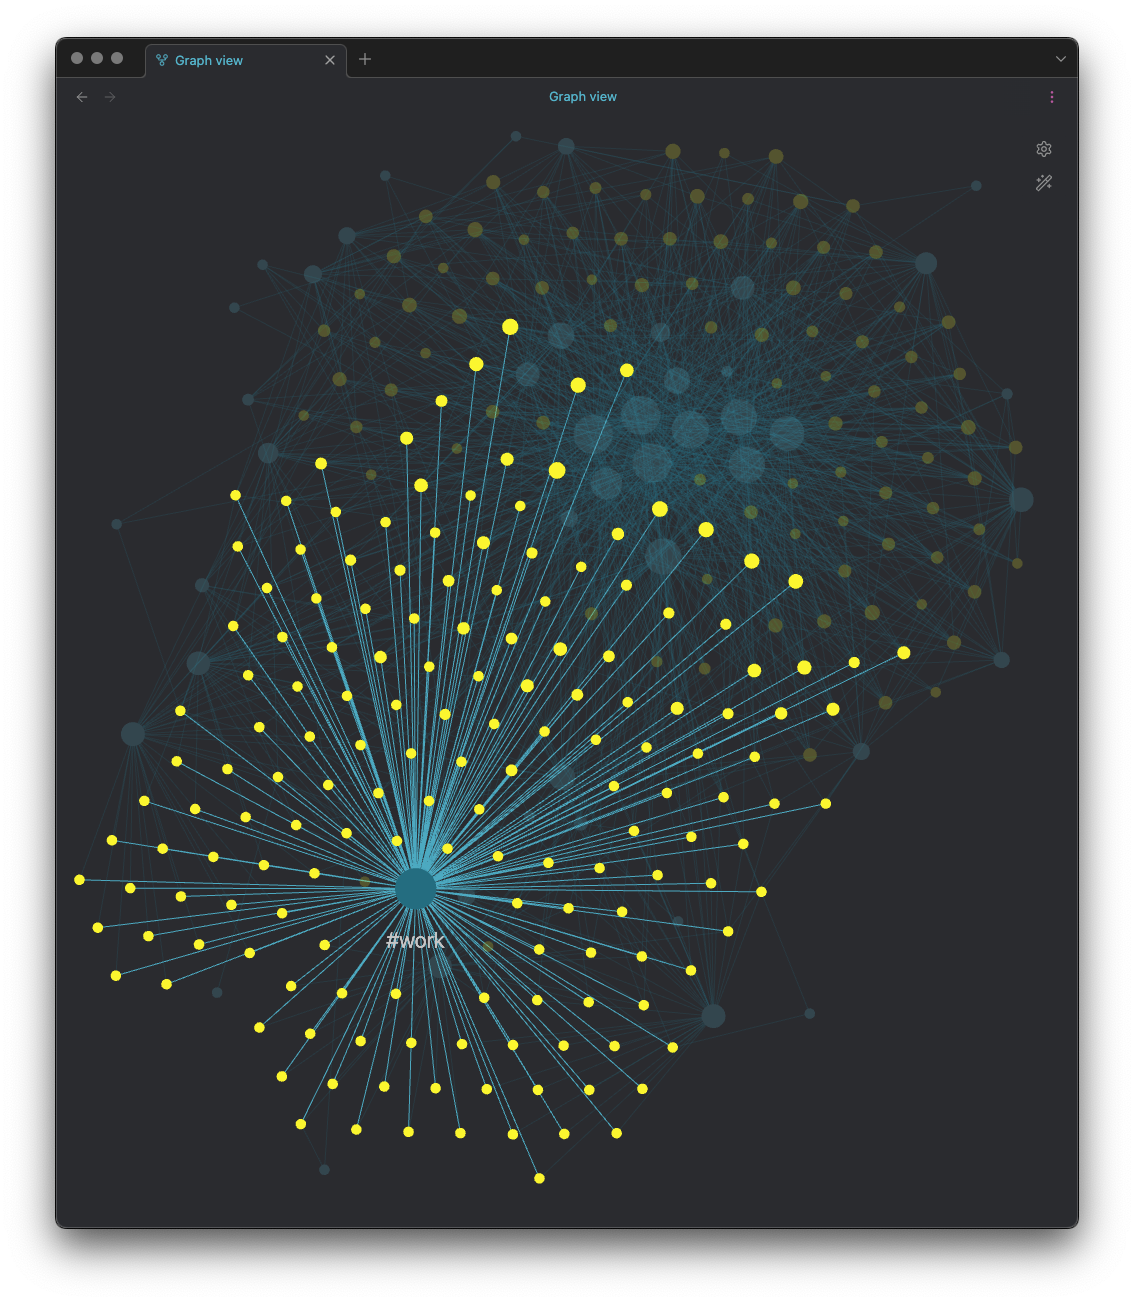
While it's not the end of this year yet, here's how that's shaping up:
Each of the yellow circles is a day, each of the blue ones is a tag of some sort. As you'd imagine, the size of the circles relates to how often that item is tagged. So I can see what proportion of my days so far this year have been tagged with being heavily involved with work:
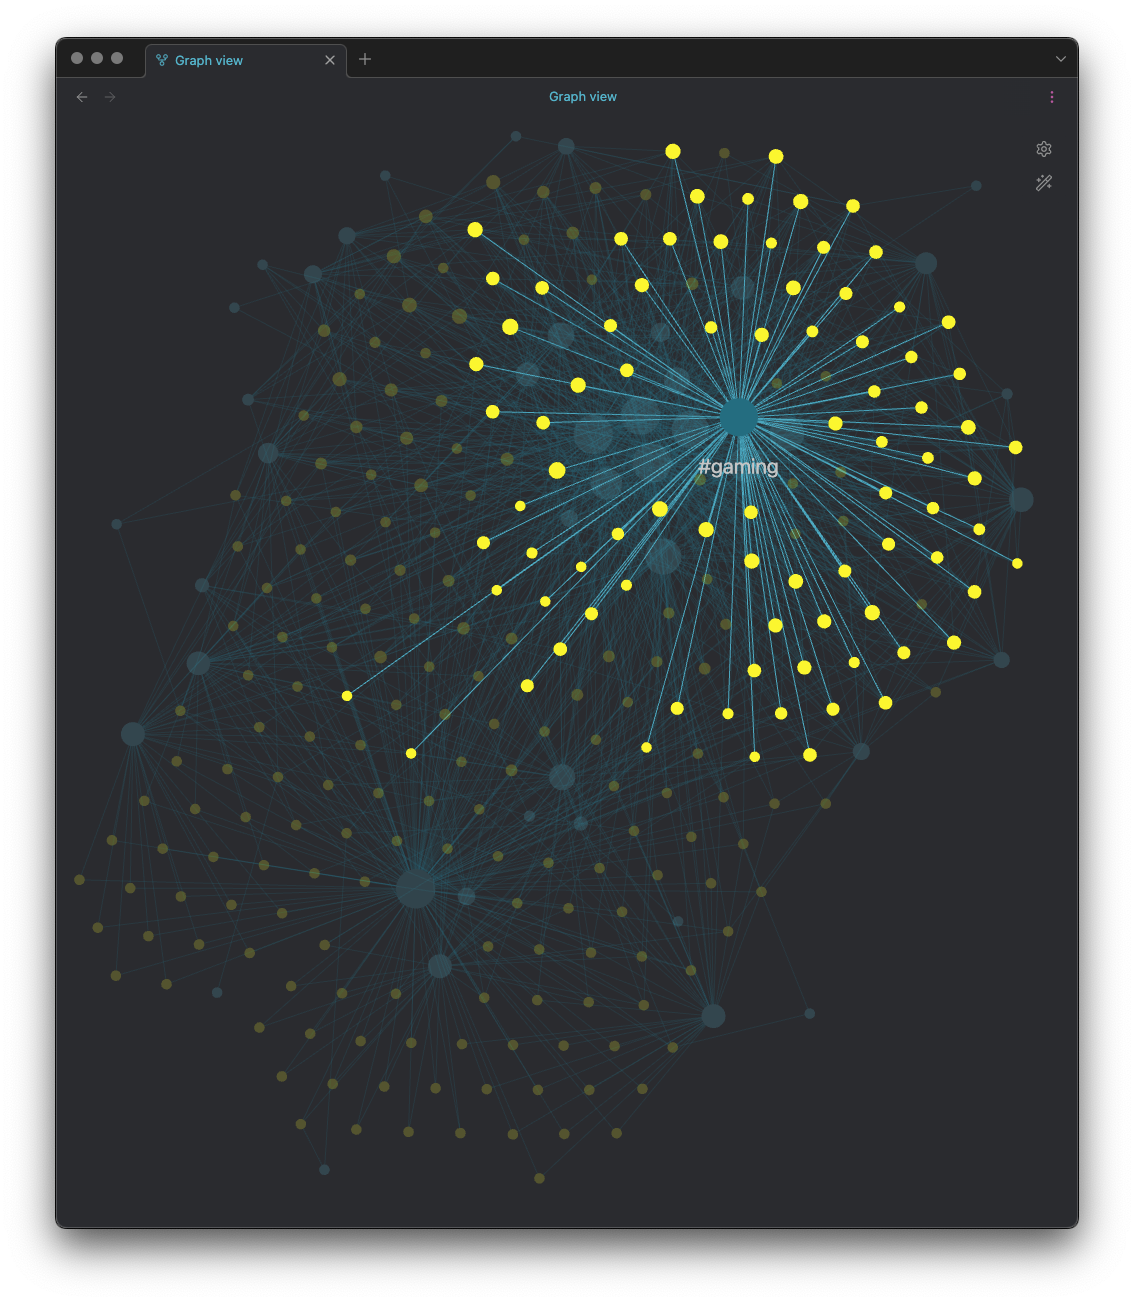
Likewise, if I want to see how many days this year have involved a significant spot of gaming:
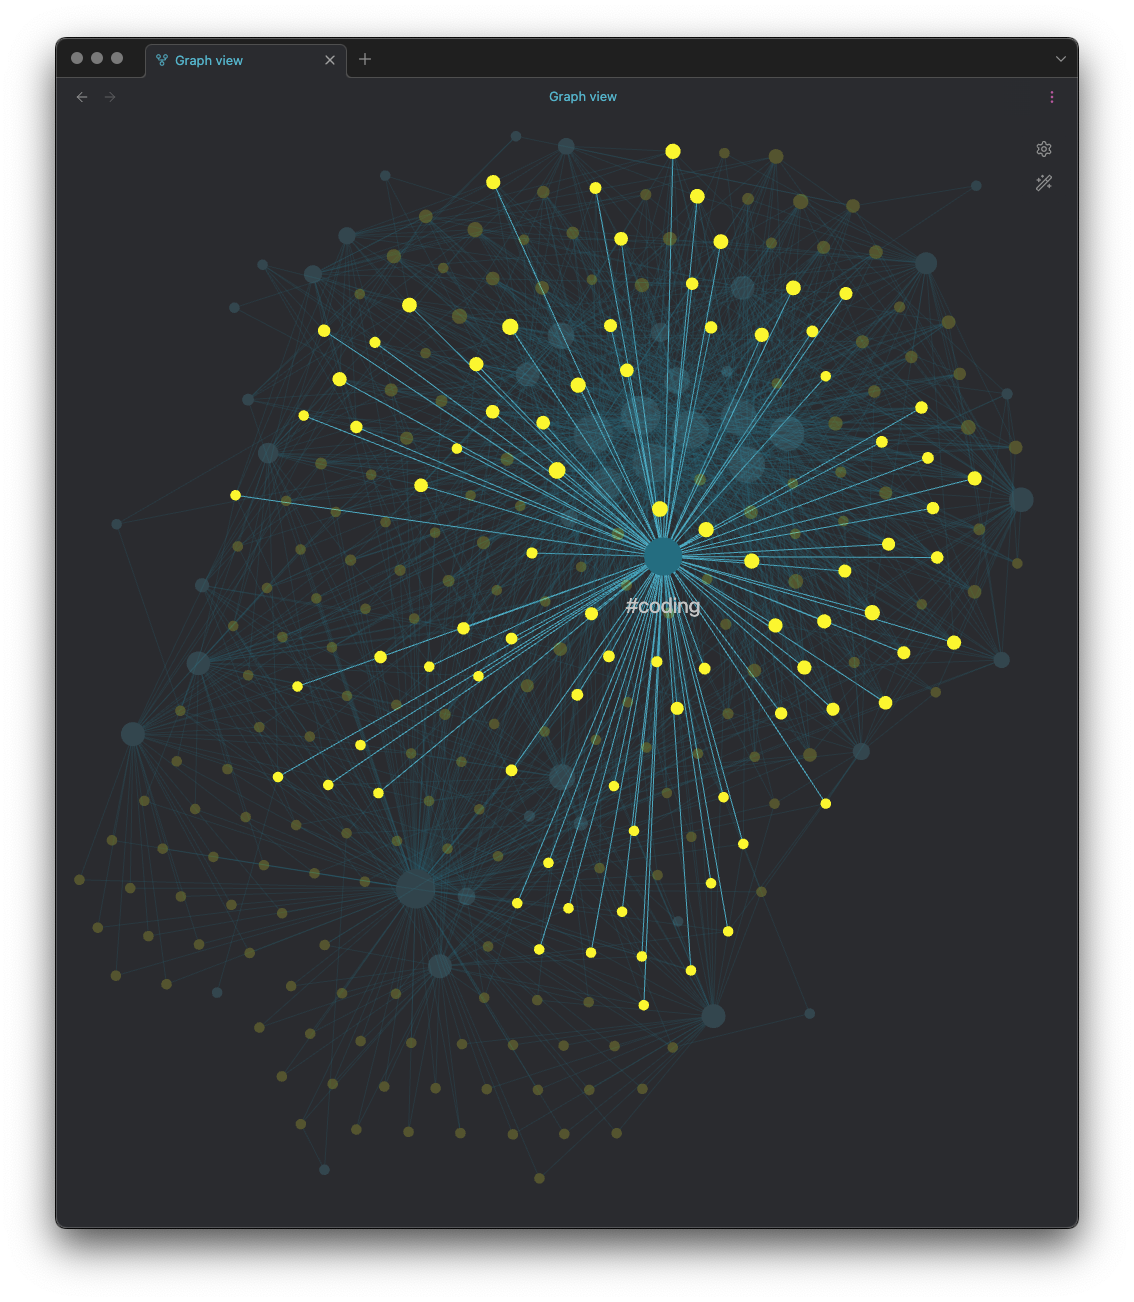
Ditto for days where I've done some coding on pet projects, or even some personal-time coding relating to work projects (it might be work, but it's also Free Software and I do like to support FOSS!)
I sort of have a curated set of tags I apply, but I've not made it a strict set; if some new situation crops up that calls for a new tag I'll use it. Mostly though I try and keep the tags pretty general so lots of days can relate to the same general subject.
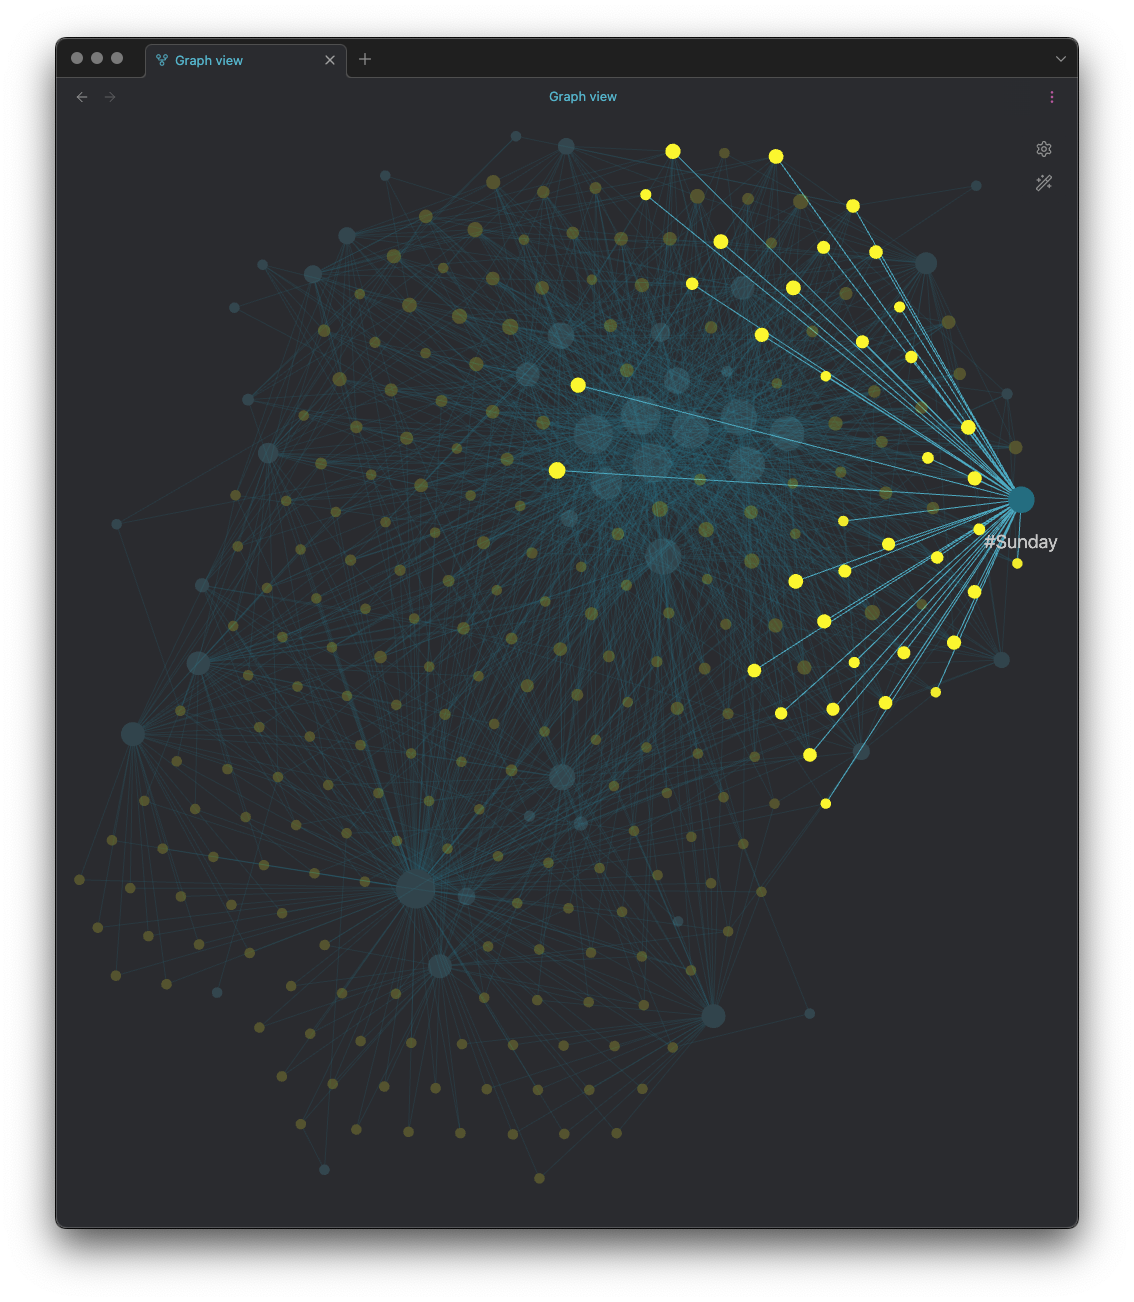
Another thing I've done is tag each and every day with the day of the week, so while it's not really surprising to find that Sunday doesn't dominate over other days, I can see which days are Sundays and perhaps wander along the connections and see what I get up to:
I don't quite know what I hope to get out of this, I don't really know if there's anything useful to be had here at all, but it will be interesting to look back over it at the end of the year. It also means that I'll have a directory hierarchy full of Markdown files, all tagged and filled with information, which I'll be able to grep and slice and dice and count and perhaps pull into a database and cross-reference with stuff and things.
Or perhaps it's all just really me not having a good use for Obsidian but inventing one anyway. ;-)