At the start of this year, as part of a much bigger process to review the work that had taken place over the previous 12 months, I was asked (at work) to provide some information about how much time I'd spent on various projects. Now, for me, there's really only one project, but there's lots of different tools and libraries that I've written to support the main work I do. All of these are split into different repositories in the company-internal instance of GitLab. This meant that getting a rough idea of what I was working on and when would be easy enough -- it's all there in the commit history.
Given that this information would make up a couple of slides at most during a far bigger presentation, I wanted something that would be snappy and easy for non-developers to follow and understand. I spent a bit of time pondering some options and decided that (ab)using a gantt chart layout would make sense.
That choice was made all the more easier given that GitLab supports the use of mermaid charts within its Markdown. This meant I could quickly write some code that took the git log of each repository, turned it into mermaid code, and then render it (by hand, this was all about getting things done quickly) via GitLab.
This sounded like it could be a fun personal project. The result was some Python code called git2gantt.
As mentioned above, the output isn't anything too clever, it's just code that can be used to create a plot via mermaid. For example, running git2gantt over itself:
gantt
  title git2gantt output
  dateFormat YYYY-MM-DD

  section git2gantt
  Development: devgit2gantt20190208, 2019-02-08, 2019-02-13
  Development: devgit2gantt20190214, 2019-02-14, 2019-02-15
  Development: devgit2gantt20190303, 2019-03-03, 2019-03-04
  Development: devgit2gantt20191203, 2019-12-03, 2019-12-04
Usage is pretty straightforward:
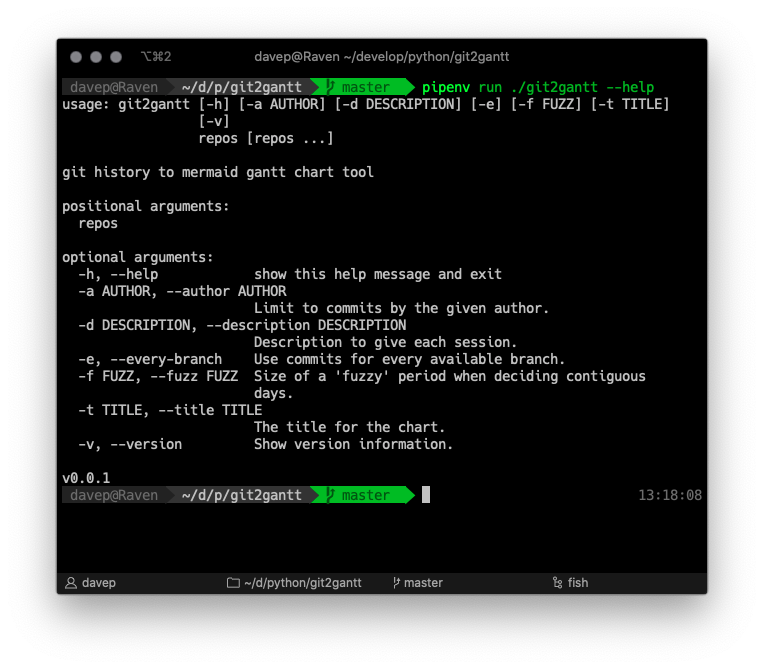
As you can see, it can be run over multiple repos at once, and there's also an option to have it consider every branch within each repository. Another handy option is the ability to limit the output to just one author -- perhaps you just want to document what you've done on a repo, not the contributions of other people.
Also especially handy, if you don't want to bore people with too much detail, is the "fuzz" option. This lets you tell git2gannt how relaxed you want it to be when it tries to decide how long a run of work on a repo lasted. So, perhaps, you're working on and off on a library that supports some other system you're documenting, but you might only be making changes every other day or so. With the correct fuzz value you can make it clear you were working on the library for a couple of weeks, despite there only being a commit every other day.
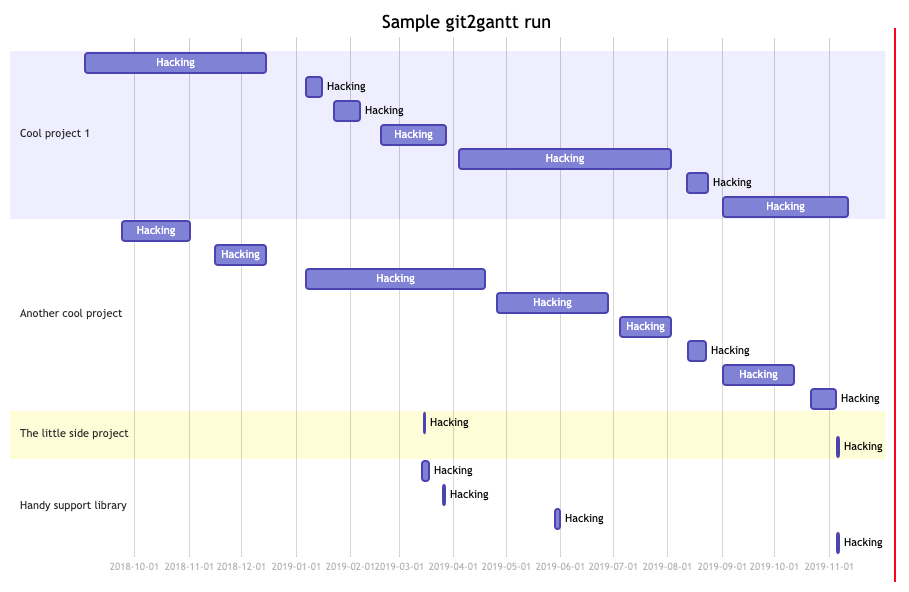
An example of running the output over a handful of projects would look something like this:
This is one of those tools I knocked up quickly to get a job done, and haven't quite got round to finishing off fully. One thing I'd really like to do is add mermaid support directly within it, so that it actually has the option to emit plots, not just mermaid code (or, perhaps, drop the mermaid approach and use something else entirely).
Meanwhile though, if you're looking for something quick and dirty that will help you visualise what you've been working on and when for a good period of time... perhaps this will help.
Have a comment or query about this post? Feel free to drop me a line about it.